
One extreme timestamp
Seven section records at 12:36:22 CST report 1,238.7 gal/ac. They account for about 0.0025 ac and 3.13 recorded gallons. Use the outlier toggle to inspect sensitivity; exclusion is not a correction.
Application evidence, a wheat-yield baseline, and the science behind the next season’s questions.
BIE – E · Biesterfeldt · Flat Land Farms
2026 observational record · Treatment response not yet measured
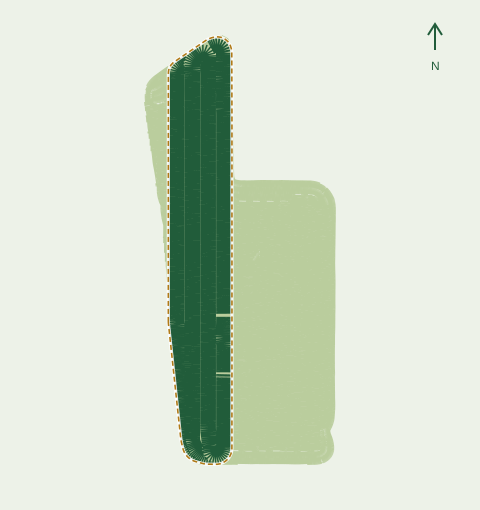
This case study characterizes a SoilFuel Plus application at BIE – E and establishes the preceding harvest as a spatial baseline. John Deere records describe the application footprint, liquid rate and operating conditions. The September wheat harvest provides context for future comparisons, while the methods and economic model make the assumptions explicit.
Current finding: the application is documented and the 29 Sep baseline shows 46.33 bu/ac inside the 09 Oct application boundary versus 47.09 bu/ac outside (−0.76 bu/ac pre-trial). A post-application harvest and matched controls are still required to assess a treatment response.
Recorded operation totals and spatial evidence.
John Deere overview totals. Liquid recorded under “Soilfuel Plus”; concentrate dose and dilution are unconfirmed. Gallons follow the export’s units.
Loading 7,194 application records and 11,388 harvest records…
Toggle harvest and application independently; application sample areas draw above harvest. Drag to pan; hover or tap a sample area for detail. Application filters and replay affect application only. Harvest remains the full September 29 baseline. Footprints use recorded heading and travel distance: logged harvest section-control widths (5–40 ft) and sprayer section widths totaling a 90 ft sprayer boom. Turn sweeps reconstruct a rigid boom between continuous logged positions and headings. Gaps and inconsistent records retain endpoint rectangles. The dashed trial boundary is the fixed convex hull of the active 09 Oct application envelope (~18.91 ground ac); it is derived from sprayer geometry rather than a separate surveyed boundary file. Post-application harvest and matched controls are still needed before inferring causal yield response.
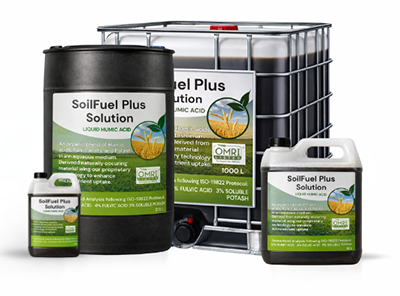
A liquid humic–fulvic product, examined here through the application record and its pre-treatment context.
The science chapter explains the chemistry of this product category. The economic model explores the response needed to cover product and application costs.
Explore the molecular scienceModel the economicsBrand and product imagery: SoilFuel and Carbon OxyTech. This case study does not imply manufacturer endorsement or independent peer review.
AAC Brandon hard red spring wheat was harvested on 29 September, ten calendar days before Soilfuel Plus was applied on 9 October. This harvest cannot measure a response to that application.
| Measurement | Recorded baseline | Interpretation |
|---|---|---|
| Harvest observations | 11,388 | No exact timestamp / section / coordinate duplicates. |
| Cumulative swath area | 43.713 ac | Distance × swath width; overlap is not removed. |
| Area-weighted yield | 46.76 bu/ac | Includes 214 zero-yield observations. |
| Reconstructed grain volume | 2,043.97 bu | Sum of recorded yield × swath area; not a scale-ticket total. |
| Weighted median yield | 45.75 bu/ac | Half the recorded swath area lies below this yield. |
| Weighted 5th–95th percentiles | 26.36–70.87 bu/ac | Spatial yield distribution, not a confidence interval. |
| Area-weighted moisture | 13.52% | Recorded grain moisture; no additional yield correction applied. |
| Recorded yield range | 0–122.80 bu/ac | All nonnegative recorded yields retained; calibration unverified. |
Fixed boundary derived from the active 09 Oct application envelope (143 convex-hull vertices, 18.914 enclosed ground ac). Harvest observations are classified by swath footprint center inside versus outside that boundary.
| Measurement | Inside trial boundary | Outside trial boundary | Inside − Outside |
|---|---|---|---|
| Before trial application · 29 Sep 2026 harvest (Baseline — measured) | |||
| Area-weighted average yield | 46.33 bu/ac | 47.09 bu/ac | −0.76 bu/ac (−1.6%) |
| Area-weighted median yield | 45.93 bu/ac | 45.66 bu/ac | +0.27 bu/ac |
| Weighted 5th–95th percentiles | 21.24–71.40 bu/ac | 29.50–70.47 bu/ac | Wider low tail inside headland/turn edges |
| Observations & swath area | 5,053 obs · 19.109 ac | 6,335 obs · 24.604 ac | 44.4% of 11,388 obs inside |
| Reconstructed grain & moisture | 885.37 bu · 13.57% | 1,158.60 bu · 13.48% | +0.09 pp moisture |
| Zero-yield observations retained | 116 (2.3%) | 98 (1.5%) | Included in area-weighted mean |
| After trial application · Post-application harvest (Paused — awaiting harvest file) | |||
| Post-application average yield | Awaiting harvest file | Awaiting harvest file | Pending |
| Before → After zone change & DiD | Pending | Pending | Will adjust for −0.76 bu/ac baseline |
Why the baseline inside/outside difference matters: before any SoilFuel Plus was applied, swath area inside the 09 Oct boundary averaged 46.33 bu/ac versus 47.09 bu/ac outside (−0.76 bu/ac), largely because headlands and zero-yield edge samples lowered the 5th percentile inside (21.24 vs. 29.50 bu/ac) even though the median was +0.27 bu/ac. Once the post-application harvest file is supplied, the before/after comparison can evaluate (After_In − After_Out) − (Before_In − Before_Out) instead of attributing pre-existing zone differences to the product.
The broad yield spread establishes substantial baseline variability to account for when evaluating future harvest layers. Using the fixed 09 Oct active application envelope (18.914 enclosed ground ac) partitions this baseline into 46.33 bu/ac inside the trial boundary versus 47.09 bu/ac outside (−0.76 bu/ac prior to treatment).
A post-application harvest is still paused/pending before any treatment response can be computed. Independent calibration checks, replicated controls, and non-treated reference verification remain necessary because these observations are not independent trial replicates.
The map uses the Esri World Imagery tile service. Both exports are WGS 84 points projected into Web Mercator to align with its tiles. Enable Satellite imagery for field context; internet access is required. If tiles fail, the recorded operation layers remain usable.
The basemap has no verified acquisition date for this field. It supports visual orientation only; it supplies no 2026 crop-vigor, NDVI, weather or treatment-response evidence. A dated, cloud-screened imagery series would be a separate analysis.
Keep the original measurements visible. Investigate exceptions before interpreting treatment performance.
Seven section records at 12:36:22 CST report 1,238.7 gal/ac. They account for about 0.0025 ac and 3.13 recorded gallons. Use the outlier toggle to inspect sensitivity; exclusion is not a correction.
5,920 of 7,194 records contain a zero target. Nonzero targets are about 20.00 gal/ac. The overview’s 4.23 gal/ac target is not a reliable whole-pass setpoint.
Air and soil temperature stay at −17.78°C; wind and humidity stay at zero. These appear to be defaults and are excluded from agronomic interpretation.
The point export reconstructs 18.726 ac and 365.960 gal, versus 18.8 ac and 363.6 gal in the overview. Differences are −0.40% and +0.65%. Deere’s internal aggregation is not reproduced.
| Measurement | Spatial export | Interpretation |
|---|---|---|
| Section observations | 7,194 / 1,076 timestamps | Repeated sections are not independent trial replicates. |
| Area-weighted median | 19.61 gal/ac | Middle of the active-area rate distribution. |
| Weighted 5th–95th percentiles | 14.83–20.93 gal/ac | Distribution across active swath area, not a confidence interval. |
| Rate >100 gal/ac excluded | 19.38 gal/ac weighted mean | All active records: 19.54 gal/ac. Threshold is an exploratory filter. |
| Fuel sum | 6.827 L | Consistent with overview’s rounded 6.8 L. |
| Recorded span | 21 min 45.6 sec | Elapsed first-to-last sample; not continuous spray-on time. |
Explore the response needed to cover your incremental cost. These are editable assumptions, not a yield forecast.
−$491.43 over 18.8 ac · CAD
Net CAD/ac = baseline yield × response × crop price − [(product price × product rate + spraying cost per pass) × number of applications + other seasonal costs]. No probability is assigned to any response.
Soilfuel describes Plus as a liquid humic–fulvic concentrate intended to support soil health, roots, and nutrient efficiency. Those are manufacturer claims. This application export cannot determine yield gain, nutrient savings, or soil-carbon change. A measured response needs comparable treated and untreated harvest data.
The September 2026 harvest and October application are imported. Add subsequent seeding, observations and harvest evidence to evaluate the trial.
Future analysis should compare matched areas and account for spatial variability. One application pass alone is not a replicated efficacy trial.
No season notes added yet.
How the chemistry could affect nutrients and roots, and what remains to be demonstrated for Soilfuel Plus.
Soilfuel’s public listing describes Plus as a liquid humic–fulvic concentrate and markets it for soil health, roots and nutrient efficiency. That establishes the claimed product category. A batch analysis, quantified humic/fulvic content, formulation pH and confirmed concentrate dose were not supplied with this trial. A precise molecular formula or product-specific mode of action cannot be assigned from the application export. Manufacturer product listing.
Humic and fulvic fractions are chemically heterogeneous materials, rather than one pure active molecule. The names reflect operational solubility classes: fulvic acid remains soluble across pH conditions. A solubility classification alone does not specify the composition or biological activity of a commercial bottle. IUPAC: fulvic acid; IUPAC: humic substances.
Carboxyl groups provide a useful chemical example. They can lose a proton, creating negatively charged sites that can interact with metal ions. The balance depends on pH and the surrounding solution. The equation below is a schematic functional group, not a structure or assay of Soilfuel Plus. IHSS: measured acidic functional groups.
Binding a nutrient changes its chemical surroundings and can affect its availability. In a tracer experiment, cucumber and barley could use iron associated with a water-soluble humic fraction from peat; cucumber uptake depended on pH. This supports a possible nutrient-delivery pathway for the tested material, not a guarantee that every humic product will increase nutrient uptake. Cesco et al., 2002 · Plant and Soil.
In maize seedlings, humic acids isolated from earthworm compost increased root development and the activity of a membrane enzyme called H+-ATPase. This enzyme uses ATP to pump protons out of cells. The resulting electrochemical gradient can support nutrient transport; changes in cell-wall acidity can also participate in growth. The experiment concerns a particular compost extract and young maize, not this formulation or a wheat field yield response. Canellas et al., 2002 · Plant Physiology.
Explore three simplified transitions. The drawings show functional groups and transport directions, not the molecular structure of Soilfuel Plus. Symbol counts do not represent concentrations or reaction stoichiometry.
A higher pH generally favors proton release from a carboxyl group. Both forms can coexist; this switch illustrates the two states without predicting their proportions.
Proton attached: this carboxyl group is electrically neutral.
The H⁺ label indicates the species released on dissociation; the bonded hydrogen is not a free ion. R represents the rest of the organic material. IHSS acid-group measurements.
Oxygen-containing sites can coordinate a metal ion. Binding and release depend on solution conditions and competing ligands. Binding alone does not prove that a nutrient reaches the plant.
Separate: metal and organic binding sites are shown apart.
Dashed lines represent coordination. The drawing is not a balanced reaction or a specified iron complex. Humic-associated iron uptake experiment.
The proton pump and nutrient transporter are different proteins. Select a step to highlight its direction across the root cell membrane.
The pump uses ATP; a separate transporter can use the resulting proton electrochemical gradient for coupled nutrient uptake.
Direction diagram; no transport stoichiometry or concentrations are implied. Humic extracts affected pump activity in a maize experiment, but this diagram does not establish that Soilfuel Plus does so. Canellas et al.; Primary evidence for proton–nitrate cotransport in maize.
A purified leonardite humic-acid experiment examined iron-related gene expression and enzyme responses in cucumber across concentrations and sampling times. It illustrates how researchers test molecular responses under controlled conditions. Those responses cannot be converted directly into a farm-level yield increase or a recommended Soilfuel Plus dose. Aguirre et al., 2009 · Plant Physiology and Biochemistry.
| Question | Useful evidence |
|---|---|
| What was applied? | Batch certificate, composition and analytical method, product pH, concentrate dose and dilution. |
| Did nutrient or root conditions change? | Matched soil and tissue measurements, root observations, timing and untreated comparisons. |
| Did the application improve yield or returns? | Calibrated post-application harvest, replicated treatment/control comparisons and actual input costs. |
The 29 September 2026 harvest precedes the 9 October application. It provides a spatial baseline and cannot demonstrate any of these proposed responses. Additional applications increase the calculator’s costs; the calculator does not assume they multiply biological benefit.
Scope: product-category chemistry and selected primary experiments. None of the cited experiments tests Soilfuel Plus. The trial’s source files establish application and baseline harvest observations, not molecular activity.
BIE-E-2026_harvest
John Deere WGS 84 point shapefile, DBF and metadata; exported 27 Oct 2026. Harvested 29 Sep 2026, 09:20–14:08 CST. Hard red spring wheat, AAC Brandon, S670 combine.
BIE - E Overview Application.pdf
John Deere Operations Center, generated 10 Oct 2026.
Export_20261010_Soilfuel_Plus_Application.zip
WGS 84 point shapefile, DBF attributes and Deere metadata. Product: Soilfuel Plus. Crop season: 2026; crop name blank.
BIE - E - Application Data.zip
Raw GS3 FDD/FDL archives retained locally. Repeated raw packages are not added to the spatial export totals; proprietary contents were not independently decoded.
Soilfuel product website · reviewed 13 Oct 2026. Product context only.
Application turn sweeps: infer the 90 ft rigid-boom center from recorded section positions and their left-to-right offsets. Between adjacent samples, fit a cubic Hermite center path using the recorded start/end headings; rotate section edges with the shortest heading change. Tessellate the swept strips at no more than 2° heading change and 2 m center travel per step. This accounts for the different inner/outer section paths during a turn.
No sweep is joined across a time gap longer than 5 s, heading jump over 45°, boom-center disagreement over 0.5 m, near-stationary travel below 0.05 m, or position-versus-distance mismatch above the larger of 0.75 m and 35% of recorded travel. Such samples retain endpoint rectangles. These are transparent reconstruction thresholds, not manufacturer corrections. Recorded source areas, volumes and rates are unchanged; geometry is not a coverage union or a corrected application-rate estimate. Boom flex, GPS offsets and motion between logs are unmeasured.
Harvest footprints and application endpoint rectangles extend backward from each recorded position by its DISTANCE, oriented by Heading. Harvest footprint width uses each record’s SWATHWIDTH (5–40 ft), including section-control reductions. Sprayer sections retain their recorded widths (10–15 ft), totaling 90 ft across the complete boom. Dimensions are corrected for latitude in Web Mercator. This is an endpoint reconstruction assumption; no GPS offset correction is applied. The default application view now adds the turn-sweep reconstruction described above; the rectangle mode remains available for comparison. Both footprint geometry and statistical totals use original recorded swath widths.
Harvest area = distance (ft) × swath width (ft) ÷ 43,560. Yield and moisture are weighted by positive swath area. All 11,388 records have positive area and nonnegative yield and are included, including zero yields. Yield units follow Deere’s VRYIELDVOL (bu/ac); moisture correction and monitor calibration are not independently verified. No overlap removal, yield cleaning, or automatic economic-baseline substitution was applied.
Active records have applied rate >0 and positive distance × section width. Swath area (ac) = distance (ft) × width (ft) ÷ 43,560. Recorded volume (gal) = Σ(area × applied rate). Weighted mean = recorded volume ÷ active swath area.
Quantiles and histograms are area-weighted. No external boundary shapefile or overlap union is included in the source exports, so reported swath acres remain cumulative rather than unique ground coverage. For spatial yield partitioning, a fixed trial boundary is derived as the 2D convex hull around active 09 Oct application footprints (AppliedRate > 0, 143 vertices, 18.914 enclosed ground ac); harvest records are classified inside versus outside by swath footprint midpoint, and Before/After comparisons remain paused until a post-application harvest file is supplied. Map positions and satellite imagery use Web Mercator. Map elevations are converted from source feet to meters (× 0.3048); CSV exports retain source feet.
All timestamps use IsoTime converted to CST (UTC−6). Zero targets and apparent weather placeholders are not used to infer treatment quality or weather. Rates remain in source gal/ac; US versus imperial gallons is not independently verified.
The application is recorded in autumn 2026. Its intended crop and harvest season must be confirmed. No causal or statistical yield claim is supported yet.